
The average Shopify store converts at 1.4% of its traffic into purchases. The top 20% of stores convert at 3.2% or higher. The top 10% hit 4.7% or above (LittleData, 2026). That gap between average and top performance is not explained by better products or more ad spend. It is explained by a systematic approach to removing friction, building trust, and optimising every touchpoint between a visitor landing and a purchase completing. In 2026, the tactics that are actually moving the needle have shifted. AI personalisation has matured from a buzzword into a measurable conversion lever. Mobile optimisation has moved from a nice-to-have into the primary battleground. And the merchants who are winning are the ones treating CRO not as a one-time redesign project but as a continuous, data-driven operating discipline. This article covers what is genuinely working in 2026, backed by data, with no filler.
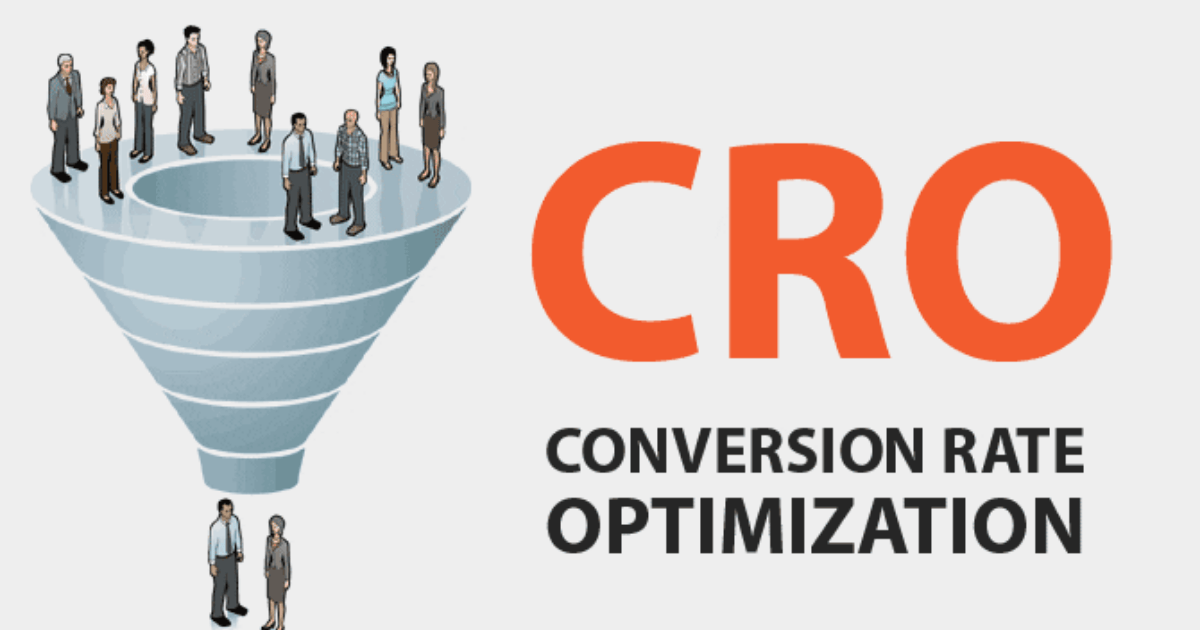
Why CRO Outperforms Traffic Acquisition as a Growth Strategy
Before covering the specific tactics, the case for prioritising CRO over traffic acquisition is worth establishing clearly, because most Shopify merchants still default to spending more on ads when they want more revenue.
Consider the maths. A store with 50,000 monthly sessions and a 1.4% conversion rate at $85 average order value generates $59,500 per month. Moving that conversion rate to 2.1%, a 50% improvement, generates $89,250 per month from the exact same traffic. That is $29,750 in additional monthly revenue without spending an extra dollar on acquisition. Achieving the same result through paid traffic alone, at a typical cost per session of $0.80 to $1.20, would require 35,000 to 50,000 additional monthly sessions at a cost of $28,000 to $60,000 per month.
As Shopify's own CRO data notes, a 1 percentage point improvement in conversion rate on a store doing $50,000 per month adds over $35,000 in monthly revenue from existing traffic. CRO improvements are also permanent. Unlike paid traffic, which stops generating revenue the moment you stop spending, a checkout optimisation or product page improvement compounds indefinitely across all future traffic.
With customer acquisition costs rising across every paid channel in 2026, the merchants who are growing profitably are the ones extracting more revenue from the traffic they already have before scaling acquisition.
Trend 1: Mobile-First Has Become the Primary Battleground
Mobile devices account for 79% of all traffic to Shopify stores (Uptek, 2026). Yet the average mobile conversion rate sits at 1.2%, compared to 1.9% for desktop. That gap represents an enormous amount of lost revenue hiding in the largest traffic segment every Shopify store has.
The cause is not that mobile shoppers are less likely to buy. It is that the mobile shopping experience on most Shopify stores was designed on a desktop and retrofitted for smaller screens, rather than built for mobile from the ground up. The symptoms are consistent across underperforming stores: buttons that are too small to tap confidently, checkout forms that require excessive zooming and scrolling, hero images that load slowly on mobile connections, and navigation menus that bury the path to purchase behind multiple taps.
The merchants closing the mobile conversion gap in 2026 are doing four things specifically:
Sticky add-to-cart bars. On mobile, a customer who scrolls past the fold loses sight of the primary CTA. A sticky bar that keeps the add-to-cart button visible as the customer scrolls through product descriptions, reviews, and images eliminates this. Baymard Institute research shows sticky add-to-cart bars increase mobile conversions by 5 to 12%, one of the highest single-element improvements available without a full redesign.
Accelerated checkout options front and centre. Shop Pay converts at a 91% completion rate on mobile versus 72% for standard guest checkout (Shopify, 2024). Apple Pay and Google Pay are close behind. These options work because they eliminate form entry entirely on mobile, where typing is the primary source of checkout friction. Stores that display accelerated checkout options prominently, not buried below a standard checkout button, see measurable uplift from the same traffic.
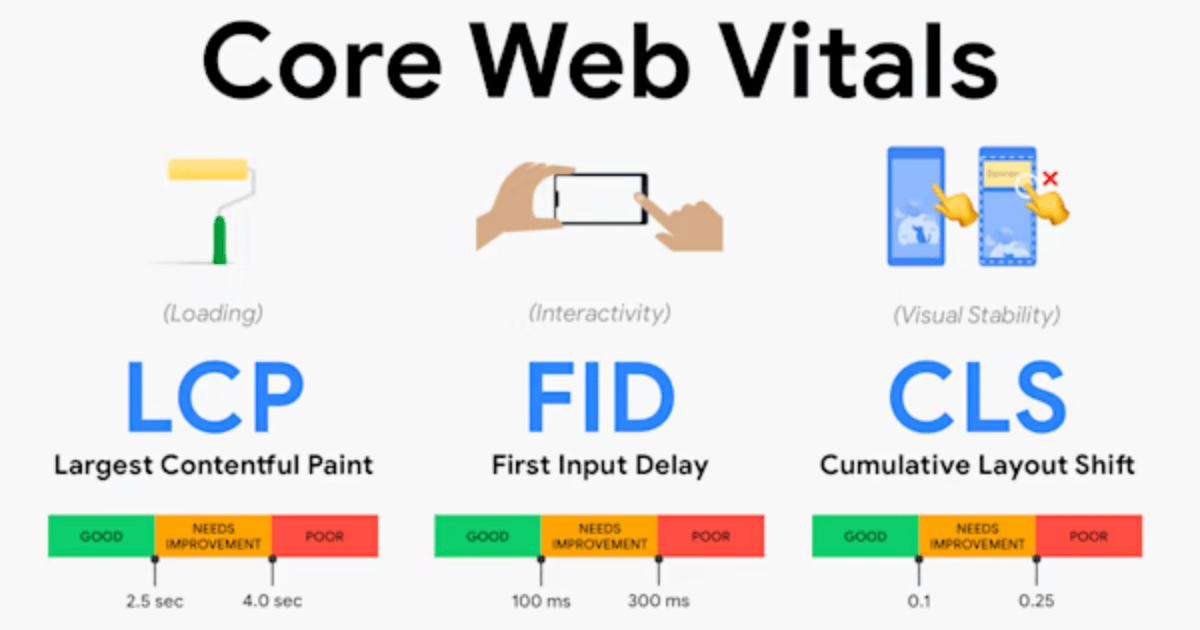
Image and page speed optimisation. A one-second improvement in mobile load time can increase conversions by up to 27% (Google research, via Ringly.io). On mobile, this means compressing images before upload, implementing lazy loading for below-the-fold content, running an app audit to remove unused JavaScript, and checking the Shopify Speed Report weekly. One fashion store cited in a 2025 case study added an Instagram feed widget and lost 3% of sales from the load time impact alone, illustrating that app additions have a direct and measurable conversion cost on mobile.
Simplified mobile navigation. Mobile menus that mirror desktop navigation structures create a tapping maze. Top-converting mobile stores in 2026 use flat navigation with three to five top-level categories, a prominent search bar, and a clear path from homepage to product page in two taps or fewer.
Trend 2: AI-Powered Personalisation Is Producing Measurable Results
Personalisation has been discussed as a CRO lever for years. In 2026, it is delivering measurable results at a price point accessible to stores of all sizes, driven by AI tools that require no data science capability to implement.
Shopify's CRO statistics note that personalised messaging produces 50% better customer re-engagement and 21% more sales conversions compared to generic messaging. Those figures apply specifically to personalisation based on customer behaviour and purchase history, not just first-name personalisation in email subject lines.
The three personalisation levers producing the most measurable conversion lifts in 2026:
Product recommendation engines on product and cart pages. A customer viewing a premium skincare serum who sees a "frequently bought together" module showing the matching moisturiser and SPF product is more likely to add both than a customer who sees a generic bestsellers list. The revenue uplift from behaviour-based recommendations versus category-based recommendations is consistent across the data. McKinsey research has shown that personalisation can deliver a 10 to 15% revenue uplift for retailers, with some implementations achieving up to 25%.
Dynamic landing pages by traffic source. A visitor arriving from a TikTok ad for a specific product should land on a page that mirrors the creative they saw, not the generic homepage. A visitor arriving from a Google search for "organic face moisturiser" should land on a page optimised for that intent. Merchants implementing traffic-source-aware landing pages consistently see higher conversion rates than those routing all traffic to a generic entry point.
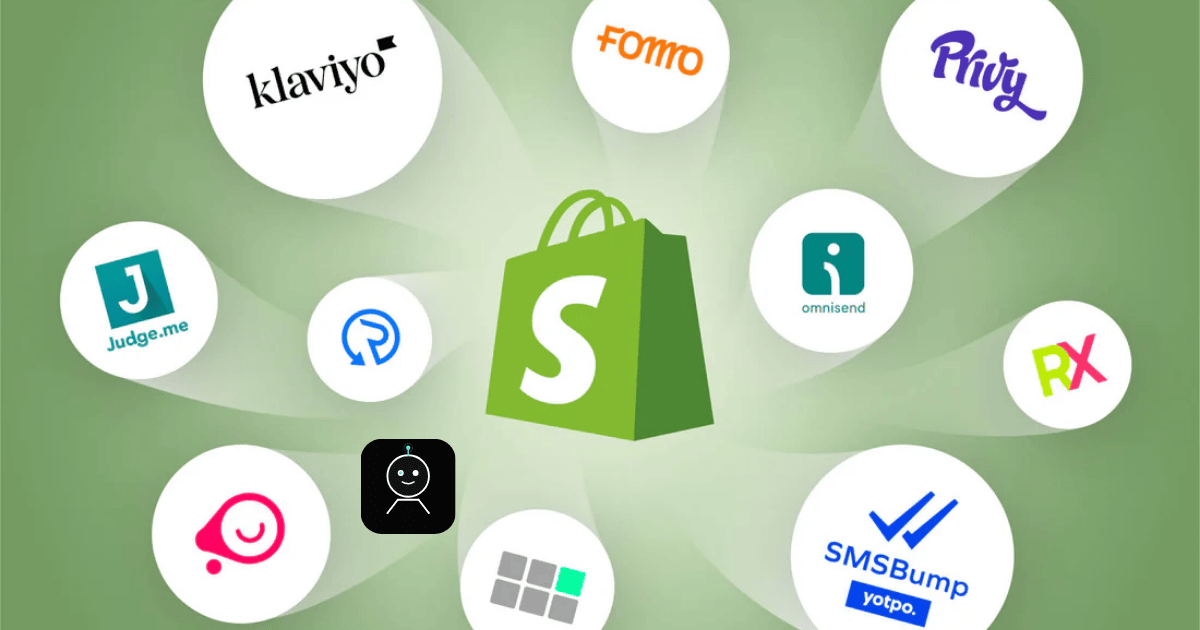
AI-driven search and discovery. Research cited by Ringly.io shows that approximately 69% of customers go directly to the search bar when they land on a store. Customers who use search convert at 2 to 3 times the rate of non-searchers (Shopify enterprise data). Shopify's native search has improved significantly, but third-party search tools with AI ranking (such as Searchie and Boost Commerce) surface more relevant results by learning from individual session behaviour, producing measurably higher add-to-cart rates from the highest-intent visitor segment.
Trend 3: Social Proof Architecture Has Become More Sophisticated
Every Shopify merchant knows reviews matter. The merchants pulling ahead in 2026 have moved beyond simply collecting reviews and are deploying social proof strategically across every stage of the purchase funnel.
"Trust is Everything: Social proof, especially product reviews, is no longer optional. Shoppers demand authentic feedback, and providing it is one of the fastest ways to lift conversions.", Yotpo, 2026
The specific social proof elements producing the most measurable conversion impact in 2026:
Review placement near the price point. Reviews displayed directly below the product title and price, rather than at the bottom of the page, are seen by a larger percentage of visitors and reduce price objections by anchoring the purchase decision in peer validation at the moment of highest consideration. Baymard Institute research consistently shows that trust signals placed near the primary CTA outperform the same signals placed lower on the page.
Photo and video reviews over text-only. A photo of a real customer using the product resolves the uncertainty that abstract product photography creates. Stores in high-uncertainty categories, fashion, skincare, home goods, see significantly higher conversion lifts from UGC (user-generated content) reviews than from text-only review counts. Yotpo's 2024 benchmark data shows that products with photo reviews convert at higher rates than products with text reviews only.
Review count thresholds. A product with 3 reviews and a 5.0 rating is less persuasive than a product with 47 reviews and a 4.6 rating. Shoppers weight volume as a signal of legitimacy. The operational implication is that review velocity, how quickly a store generates reviews on new products, is a conversion rate variable, not just a marketing variable. Stores that send review requests within 7 days of confirmed delivery generate review counts 3 to 4 times faster than stores that wait 30 days.
Trust badges at checkout. Research cited by Thunderbit shows that 19% of customers abandon carts due to trust concerns at the payment stage. Trust badges displaying SSL security, accepted payment methods, and money-back guarantee policies at the payment step directly address the concern that causes nearly one in five abandoners to leave.
Trend 4: Checkout Optimisation Remains the Highest-Leverage Single Intervention
Checkout is where purchase intent converts into revenue or evaporates into abandonment. With a global cart abandonment rate of 70.19% (Baymard Institute, 2024), the checkout stage is where the majority of conversion opportunity is lost, and where the highest-leverage fixes live.
The specific checkout improvements producing the largest conversion lifts in 2026:
Guest checkout as the default path. Forcing account creation before purchase is consistently identified as the top checkout abandonment trigger. Baymard's research shows 24% of US shoppers have abandoned a checkout in the last three months specifically because account creation was required. The fix is straightforward: make guest checkout the primary path and offer account creation as an optional post-purchase step.
Shopify's one-page checkout. Shopify's one-page checkout, now the default for all stores, reduces the number of page loads and form interactions required to complete a purchase. Shopify's own data shows meaningful checkout completion rate improvements from the one-page format versus the previous three-step flow, driven primarily by the reduction in mobile friction.
Transparent cost display before checkout. Baymard Institute identifies unexpected shipping costs as the trigger for 47% of checkout abandonment. Merchants who display shipping costs on the product page and in the cart, before the customer reaches checkout, eliminate the price mismatch that causes this abandonment category. A free shipping threshold bar in the cart (showing how much more the customer needs to add to qualify for free shipping) addresses this while also increasing average order value. UPS Pulse of the Online Shopper data shows free shipping thresholds set 15 to 20% above AOV increase average order value by 12 to 18%.
Exit-intent recovery. Exit-intent popups triggered when a customer moves to close the tab or navigate away recover 3 to 5% of abandoning visitors (OptinMonster). At scale, that recovery compounds significantly. A store abandoning 2,000 carts per month at $85 AOV, recovering 4% through exit-intent, recovers 80 orders, $6,800 in monthly revenue from visitors who had already decided to leave.
Trend 5: A/B Testing Is Now a Standard Practice, Not an Advanced One
Approximately 40% of Shopify stores are actively running A/B tests (OptiMonk, 2026). That means 60% are still making design and copy decisions based on intuition rather than data, and leaving the conversion gains that testing reveals on the table.
A/B testing matters specifically because conversion decisions that seem obvious are frequently wrong. Shopify's own CRO documentation cites an ecommerce agency test on grooming brand Live Bearded: testing a variant of a slide-out cart with additional trust signals and iconography increased conversion by 18% above the baseline. The winning variant was not the one the design team predicted would win.
Studies show A/B testing can increase conversion rates by up to 30% when applied systematically to high-traffic pages (Uptek, 2026). The highest-value elements to test in 2026:
Product page headline and subheading copy, benefit-led versus feature-led, specific versus general
CTA button text and colour, "Add to Cart" versus "Get Yours" versus "Buy Now" produce measurably different click-through rates by category
Product image sequence, which image leads, whether lifestyle or product-only images convert better for specific categories
Pricing and offer framing, subscription versus one-time, bundle versus individual, urgency versus value framing
Review placement, above the fold versus below the product description
Shopify does not have a native store-wide A/B testing tool. Third-party tools including Intelligems, Convert, and VWO integrate with Shopify and allow testing without developer involvement for most common test types.
The statistical discipline of A/B testing is worth understanding before running tests. A test needs a minimum sample size to produce statistically significant results, typically several hundred conversions per variant. Running a test for three days on a low-traffic store and declaring a winner produces noise, not data. The minimum meaningful test duration for most stores is two to four weeks, and the result should reach 95% statistical confidence before a decision is made.
Trend 6: Product Page Depth Is Driving Conversion in High-AOV Categories
For stores selling products above $100, the product page is doing the job that a salesperson would do in a physical retail environment. Customers in this category do not make impulse purchases. They resolve uncertainty. Every piece of information that reduces uncertainty moves them closer to purchase.
The specific product page elements producing the largest conversion improvements in high-AOV categories in 2026:
Multiple image angles and video. A customer who cannot physically touch or try a product needs to see it from every angle that would matter in person. Front, back, detail shots, lifestyle context, scale reference (the product next to a recognisable object or on a person), and a short video showing the product in use. Stores that add video to product pages in high-consideration categories report conversion rate improvements of 20 to 30% on those specific products, the video resolves the tactile uncertainty that static images cannot.
Specific delivery date display. CRO Digital Marketing research identifies delivery timeline uncertainty as a significant conversion blocker, particularly for time-sensitive purchases. "Ships in 3-5 business days" is less persuasive than "Order today, arrives Tuesday April 7." The specific date anchors the commitment and removes the open-ended uncertainty that causes hesitation.
Explicit material and specification detail. In high-AOV categories, customers who have questions about specifications that are not answered on the product page leave to find the answer elsewhere and often do not return. Every question a customer would ask a salesperson, what is it made of, what are the exact dimensions, how does sizing work, what does the warranty cover, should be answered on the product page before the customer asks it.
Clear size guides and fit information. In fashion and apparel, fit uncertainty is the primary driver of purchase hesitation. A size guide that includes actual measurements rather than S/M/L designations, alongside a model size reference and a clear explanation of the fit style (slim, regular, relaxed), reduces hesitation in the highest-return category in Shopify's merchant base.
Trend 7: Post-Purchase CRO Is an Underexploited Lever
Most CRO attention focuses on the pre-purchase journey: traffic, product pages, checkout. The post-purchase experience, the period between a completed order and the customer's next decision about your brand, is a CRO lever that most merchants have barely touched.
The repeat purchase rate for the average Shopify store is approximately 28% (Uptek, 2026). Loyal customers spend up to 67% more than new ones (Shopify CRO statistics). The difference between a store converting at 1.4% with a 20% repeat rate and a store converting at 1.4% with a 35% repeat rate is not visible in the primary conversion rate metric, but it is enormous in actual revenue.
The post-purchase CRO interventions producing measurable results in 2026:
Order confirmation email with a product tip. The confirmation email is opened by 60 to 70% of customers. A single genuine product use tip in that email, not a cross-sell, just useful information about the product they bought, increases brand engagement and sets the foundation for repeat purchase at almost zero cost.
Delivery confirmation with a cross-sell. Sent 24 hours after the carrier marks the order delivered, when the customer has received and ideally started using the product. The cross-sell recommendation at this moment, presented as a natural complement to what they already have rather than as a promotion, converts at higher rates than the same recommendation in a cold promotional email.
Review request with specific framing. Sent 7 days post-delivery with a direct link to the review platform. The framing matters: "if you have a minute, one sentence helps other people decide" outperforms "please leave us a 5-star review." The honest ask generates more reviews and generates better-quality reviews.
The CRO Audit: Where to Start
For merchants who want to apply the trends above systematically rather than randomly, the starting point is an audit of their current funnel using Shopify's native analytics, supplemented by behavioural data from a tool like Hotjar or Microsoft Clarity (free).
The four audit questions that reveal the highest-leverage opportunities:
What is my add-to-cart rate? The Shopify benchmark is approximately 7.52% (Blend Commerce, 2026). If your rate is below 5%, product page and trust signal improvements are the priority. If it is above 8% but your conversion rate is low, checkout friction is the primary problem.
What is my mobile versus desktop conversion split? If mobile converts at less than half your desktop rate, mobile experience optimisation (sticky CTA, accelerated checkout, speed) is the highest-leverage investment.
At which step of checkout do customers drop? Shopify's checkout analytics shows abandonment by stage. Drops at address entry suggest address friction or cost shock. Drops at payment suggest trust concerns.
What is my repeat purchase rate? If below 25%, post-purchase email sequencing and product page depth are the priorities. If above 30%, the product and post-purchase experience are working, scaling traffic acquisition becomes the higher-leverage investment.
CRO is not a one-time project. The stores converting at 4% and above are the ones that run one or two tests per month, measure everything, and apply what they learn to every subsequent decision. The compounding effect of that discipline over 12 months is what separates the stores at 4.7% from the ones still stuck at 1.4%.